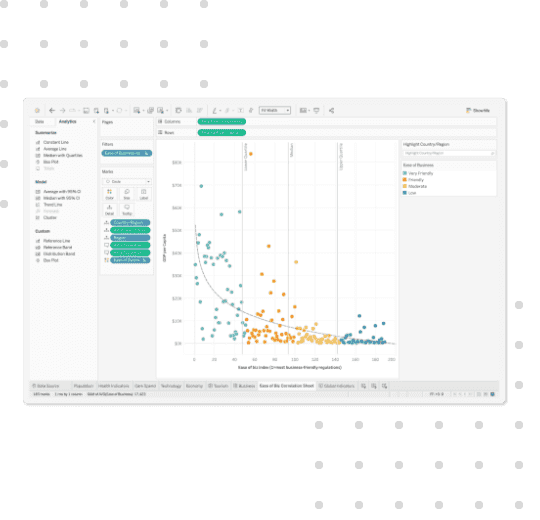
We are Tableau partners since 2013, creating projects with Retail, Pharmaceutical and Consumer Products industries for national and transnational companies, implementing Tableau to its fullest potential, creating truly intuitive visualizations for end-user decision making.

Do you have questions about Tableau? Do you need a demo? Ask for a free session with our experts.

Courses and training

Update your knowledge constantly to keep building your career plan in this increasingly analytical world.

Licensing

We help you configure your best licensing scenario.

Our experience

paper and pencil
100
Projects completed since 2010
board
500 Millions
Registration in a single project
user
+100 Users
In projects
user
+10 Certified
Consultants
Ready to accelerate your project
Industry experts: Retail, Consumer Products and Pharmaceuticals.

We have accelerators to make your Tableau implementation go faster

  • Discovery Process: We define your project strategy in only 3 weeks.
  • Projects with Tableau Embedded.
  • Projects with Tableau Prep.
  • Tableau MVP Accelerator (10 days).
  • Corporate Brandbook.
  • Healthcheck Process and Tableau Centers of Excellence.
  • Creating a semantic layer for my Tableau dashboards with Snowflake or Databricks.
  • Machine Learning possibilities with Tableau (Einstein Analytics).
  • UI/UX Dashboards Design (Storytelling).

Case studies

  • branch store

    Financial, Commercial and Operational Dashboard

    Healthcare Industry

    The data strategy was developed with a semantic intermediate layer with snowflake in order to centralize the information of all dental clinical branches contained in Odoo and PostgressSQL. Dashboards in Tableau were developed for the operational business areas (appointment monitoring, type of diagnosis, patient waiting times, etc), commercial indicators (revenue by specialty, treatment, branch, etc) and financial dashboards to have their income statement reports at both corporate and branch levels.

  • pills

    Market Share Dashboard

    Pharmaceutical Sector

    A dashboard was developed in Tableau to monitor the evolution of the sales of the products of this laboratory in comparison with the sales of the competition. Key databases of the pharmaceutical sector such as IMS, medical visits, and their internal sales contained in SAP were consumed in order to create indicators such as Evolution Index, Market Share, Sales vs. objectives, at the level of brick, medical specialty, brand, laboratory, medical specialist, events, etc. Our experience in the pharmaceutical sector was key to accelerate the development of this solution.

  • two people watching

    Dashboard Monitoring education platforms

    Education Sector

    Within the academic sector, the body that regulates academic institutions in Mexico requested the development of a Dashboard to help monitor the use of the Google Classroom platform during the pandemic which was monitored by federal entity, division and advisors level, with indicators such as number of contracts and the amount they represent. The information is extracted from different sources such as G suite, Facebook, YouTube, mailchimp for external variables, and google big query for the metadata of the use of Google Classroom.

Courses and training

Learn how to get the most out of your data with Tableau, become an expert with our training path geared towards business users who love data. Prepare for your Tableau certification with our official course.

  • The facilitator has extensive knowledge of tableau and is able to support the group and answer all questions easily and clearly
    Basic Course Tableau
    roche
  • An excellent application and instructor. It will be very useful for us
    Basic Course Tableau
    televisa
  • The exercises in the course is when you learn the most because it gives you the opportunity to think about how to solve cases. For me, it is the most fun part of the training
    Basic Course Tableau
    italika

Do you need Licensing?

To help you estimate the best licensing configuration, it is important to know:

  • network How many users do you want to reach?
  • pencil What types of users do you want to reach?
  • monitor Reports, dashboards, super users building data models?

These types of factors directly impact the cost of your annual licensing and we will help you arrive at your best investment scenario.

In addition, by having us as your licensing provider, Derevo will give you annual support included at no extra cost.*

Request a quote
tableau screenshot